Atlas Grazing Webinar: Product Introduction and Key Features


This webinar provides a high-level walkthrough of Atlas Grazing, showing how the tools are used to manage livestock, paddocks and grazing decisions in a real-world setting.
Bart Davidson gives us some context on the creation of Atlas Grazing, then Emily Mosely walks through the product itself, demonstrating how it supports decisions with key features such as the digital farm map, livestock inventory and tracking, graze charts, and feed budgeting.
Read the Summary
Where Atlas Grazing Came From
The team open with the origins of our original product, MaiaGrazing, which was built to address a very specific challenge around simplifying high-pressure decision-making in grazing systems.
MaiaGrazing moved tools that once relied on pen and paper, or a spreadsheet, into a simplified online version.
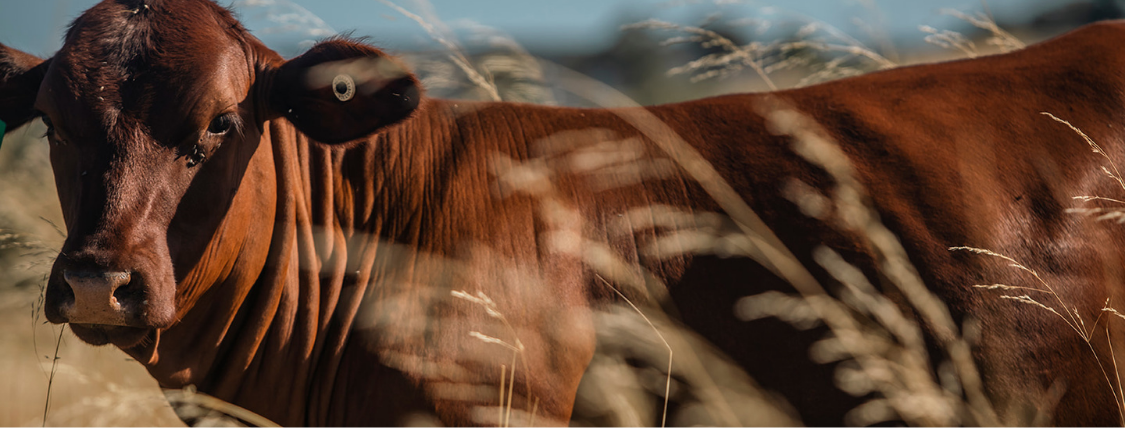
Chief Grazing Officer, Bart Davidson, shares an on-farm example from 2013 where delayed decisions, combined with disconnected information, led to a significant financial loss. The data was available, but it was not organised in a way that supported timely action.
That experience shaped MaiaGrazing, with the aim of bringing more structure and objectivity into grazing decisions.
Atlas Grazing builds on that foundation. It was created with the same underlying purpose, and with the aim to deliver a platform that is simpler, faster and more integrated.
Core Product Features
This webinar focuses on the following features of Atlas Grazing:
- Digital Farm Map
- Livestock Inventory and Tracking
- Mobile-first Design
- Graze Chart and Pasture Planning
- Feed Budgeting
Digital Farm Map
The first thing you see when opening Atlas Grazing is your farm map and dashboard. From this view, the property is mapped out with paddocks, mobs, infrastructure and upcoming tasks all visible in one place. This allows you to understand what's happening across your operation at a glance.
You can move from the map into individual paddocks to review grazing history, recovery periods and performance metrics. Livestock records sit alongside this, showing mob locations, movements and inventory changes.
Livestock Inventory and Tracking
Each paddock carries its own performance history, including graze duration, recovery periods, yield and longer-term trends. These measures describe how the land is responding over time and provide a clear picture of how the system is functioning.
Livestock records are managed within the same environment, capturing purchases, sales, births, deaths, movements and changes through the reproductive cycle. Because these records are directly linked to grazing activity, the system can calculate feed demand, stocking rate and grazing pressure automatically.
Atlas Grazing leverages your day-to-day operation records into measurable, actionable insights that drive your decision-making and productivity.
Built for the Paddock
The design of Atlas Grazing reflects how work is carried out on-farm.
The mobile app allows information to be recorded while you’re out and about across your farm, even without connectivity. Updates are captured as events occur and then synchronised across devices once a connection is available.
This helps keep records current and reduces the need to revisit information later. It also allows multiple people involved in the operation to work from the same set of up-to-date records.
Graze Planning
The graze planner provides a structured way to organise grazing activity, and allows for adjustments as conditions change.
Users can plan rotations, schedule mob moves and view grazing activity across different timeframes. The Atlas Grazing graze planner is built for adaptability, so you can make updates on the fly and keep track of changes with ease.
There are two main approaches to planning within the tool. One is based on paddock condition and recovery, where paddocks are ranked, and rotations are built from that order. The other uses feed on offer, allowing graze periods to be calculated based on pasture availability and livestock demand.
Each method reflects practical approaches already used by producers, with the tool providing a way to organise and visualise those decisions more clearly.
Forecasting and Decision-Making
The forecasting tools bring together rainfall data, feed availability and livestock demand to allow users to track graze pressure and adjust proactively to any over-or under-stocking scenarios.
Stocking pressure is tracked against benchmark carrying capacity, giving users a clear sense of where the operation sits and how it is likely to track over time.
This creates more room to act and supports more measured decision-making.
Scenario modelling extends this capability by allowing users to test different seasonal scenarios. Adjustments to rainfall and livestock numbers can be simulated to understand how those changes affect total graze demand and feed supply. Ultimately, this allows users to be prepared for any changes that need to be made ahead of time.
What’s Next
The team describe Atlas Grazing as the first iteration of a rebuilt system.
The updated architecture allows for ongoing and faster development and integration with other technologies. Future directions include individual animal tracking, water monitoring, satellite imagery, additional data inputs, and many other layered and data-backed insights.
The focus remains on building practical capabilities that align with how a farming business actually runs.
Ready to try Atlas Grazing?
Schedule your interactive demo here


Stay across what matters in agriculture.
Subscribe to our newsletter.
Listen the latest episode
of Stockyard Sessions.


.png)
.png)
.png)


